Scientific Programming II | Self-assessment
Global warming - Exercise 1
Is the average temperature in the Netherlands on the rise? The answer is yes, but let's investigate the data ourselves. The Royal Netherlands Meteorological Institute (Koninklijk Nederlands Meteorologisch Instituut - KNMI) offers a comprehensive dataset containing monthly temperature averages from 1901 to 2016, accessible here.
The question we are trying to answer with this data is: Can we find any visually compelling evidence for climate change in the form of increasing average temperatures in the Netherlands over the last century?
About the data:
The dataset comprises four comma-separated values (CSV) files. Each file covers around 30 years of data. The first file, tas_1901_1930_NLD.csv, consists of 361 lines, including a header line and data for 30 years of 12 months each (1 + 30 x 12 = 361). The initial 10 lines of this file are as follows:

The first line serves as the header, describing the column information. Each line represents data for a specific month, with values separated by commas. The values are presented in the following order:
1. The average temperature of the month
2. The year
3. The month
4. The country (always the Netherlands for this dataset) 5. The ISO3 code for the country (NLD)
Your task:
Your first task is to create a plot that displays the average temperature per year. Given that the data is organized as the average temperature per month, you need to aggregate this information. Since the data is spread across four separate files, you must somehow combine it. We recommend using matplotlib for plotting, although other Python plotting libraries are also suitable. Ensure that your axes are clearly labeled.

When you're done, your plot should resemble the following example →
Does this plot suggest an increase in average temperature?
Global warming - Exercise 2
Students who have successfully completed Scientific Programming 1 should be able to tackle the previous exercise with some effort. If you can accomplish it within a reasonable timeframe, you likely possess the necessary skills for Scientific Programming 2. For absolute certainty, consider proceeding to the next task.
Your task:
Average temperatures tend to fluctuate significantly from year to year, which can make it challenging to see a clear trend from the previous plot. To improve clarity, consider using larger time windows. In addition to the yearly averages plot, create a decadal averages plot. In other words, calculate the average temperature per decade and overlay this on the previous plot.
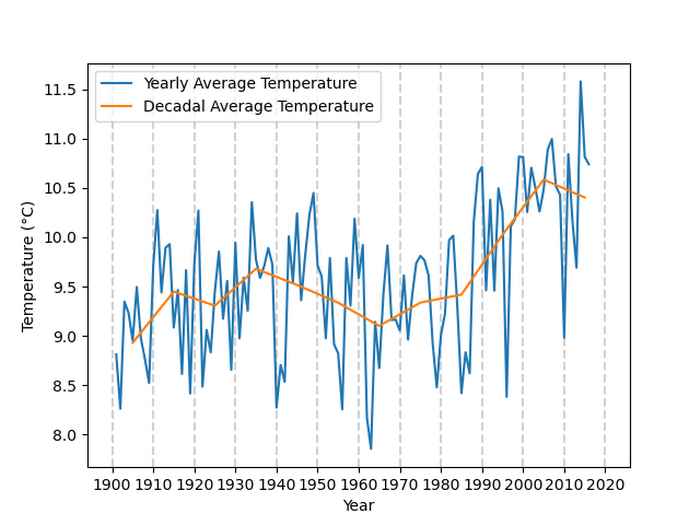
The resulting visualization should resemble the following example →
Does this modification make it easier to see whether the average temperature is on the rise?
Contact
If you have questions about your self-assessment or if you're not sure about your readiness for Scientific Programming II, don't hesitate to contact us: scientific@mprog.nl