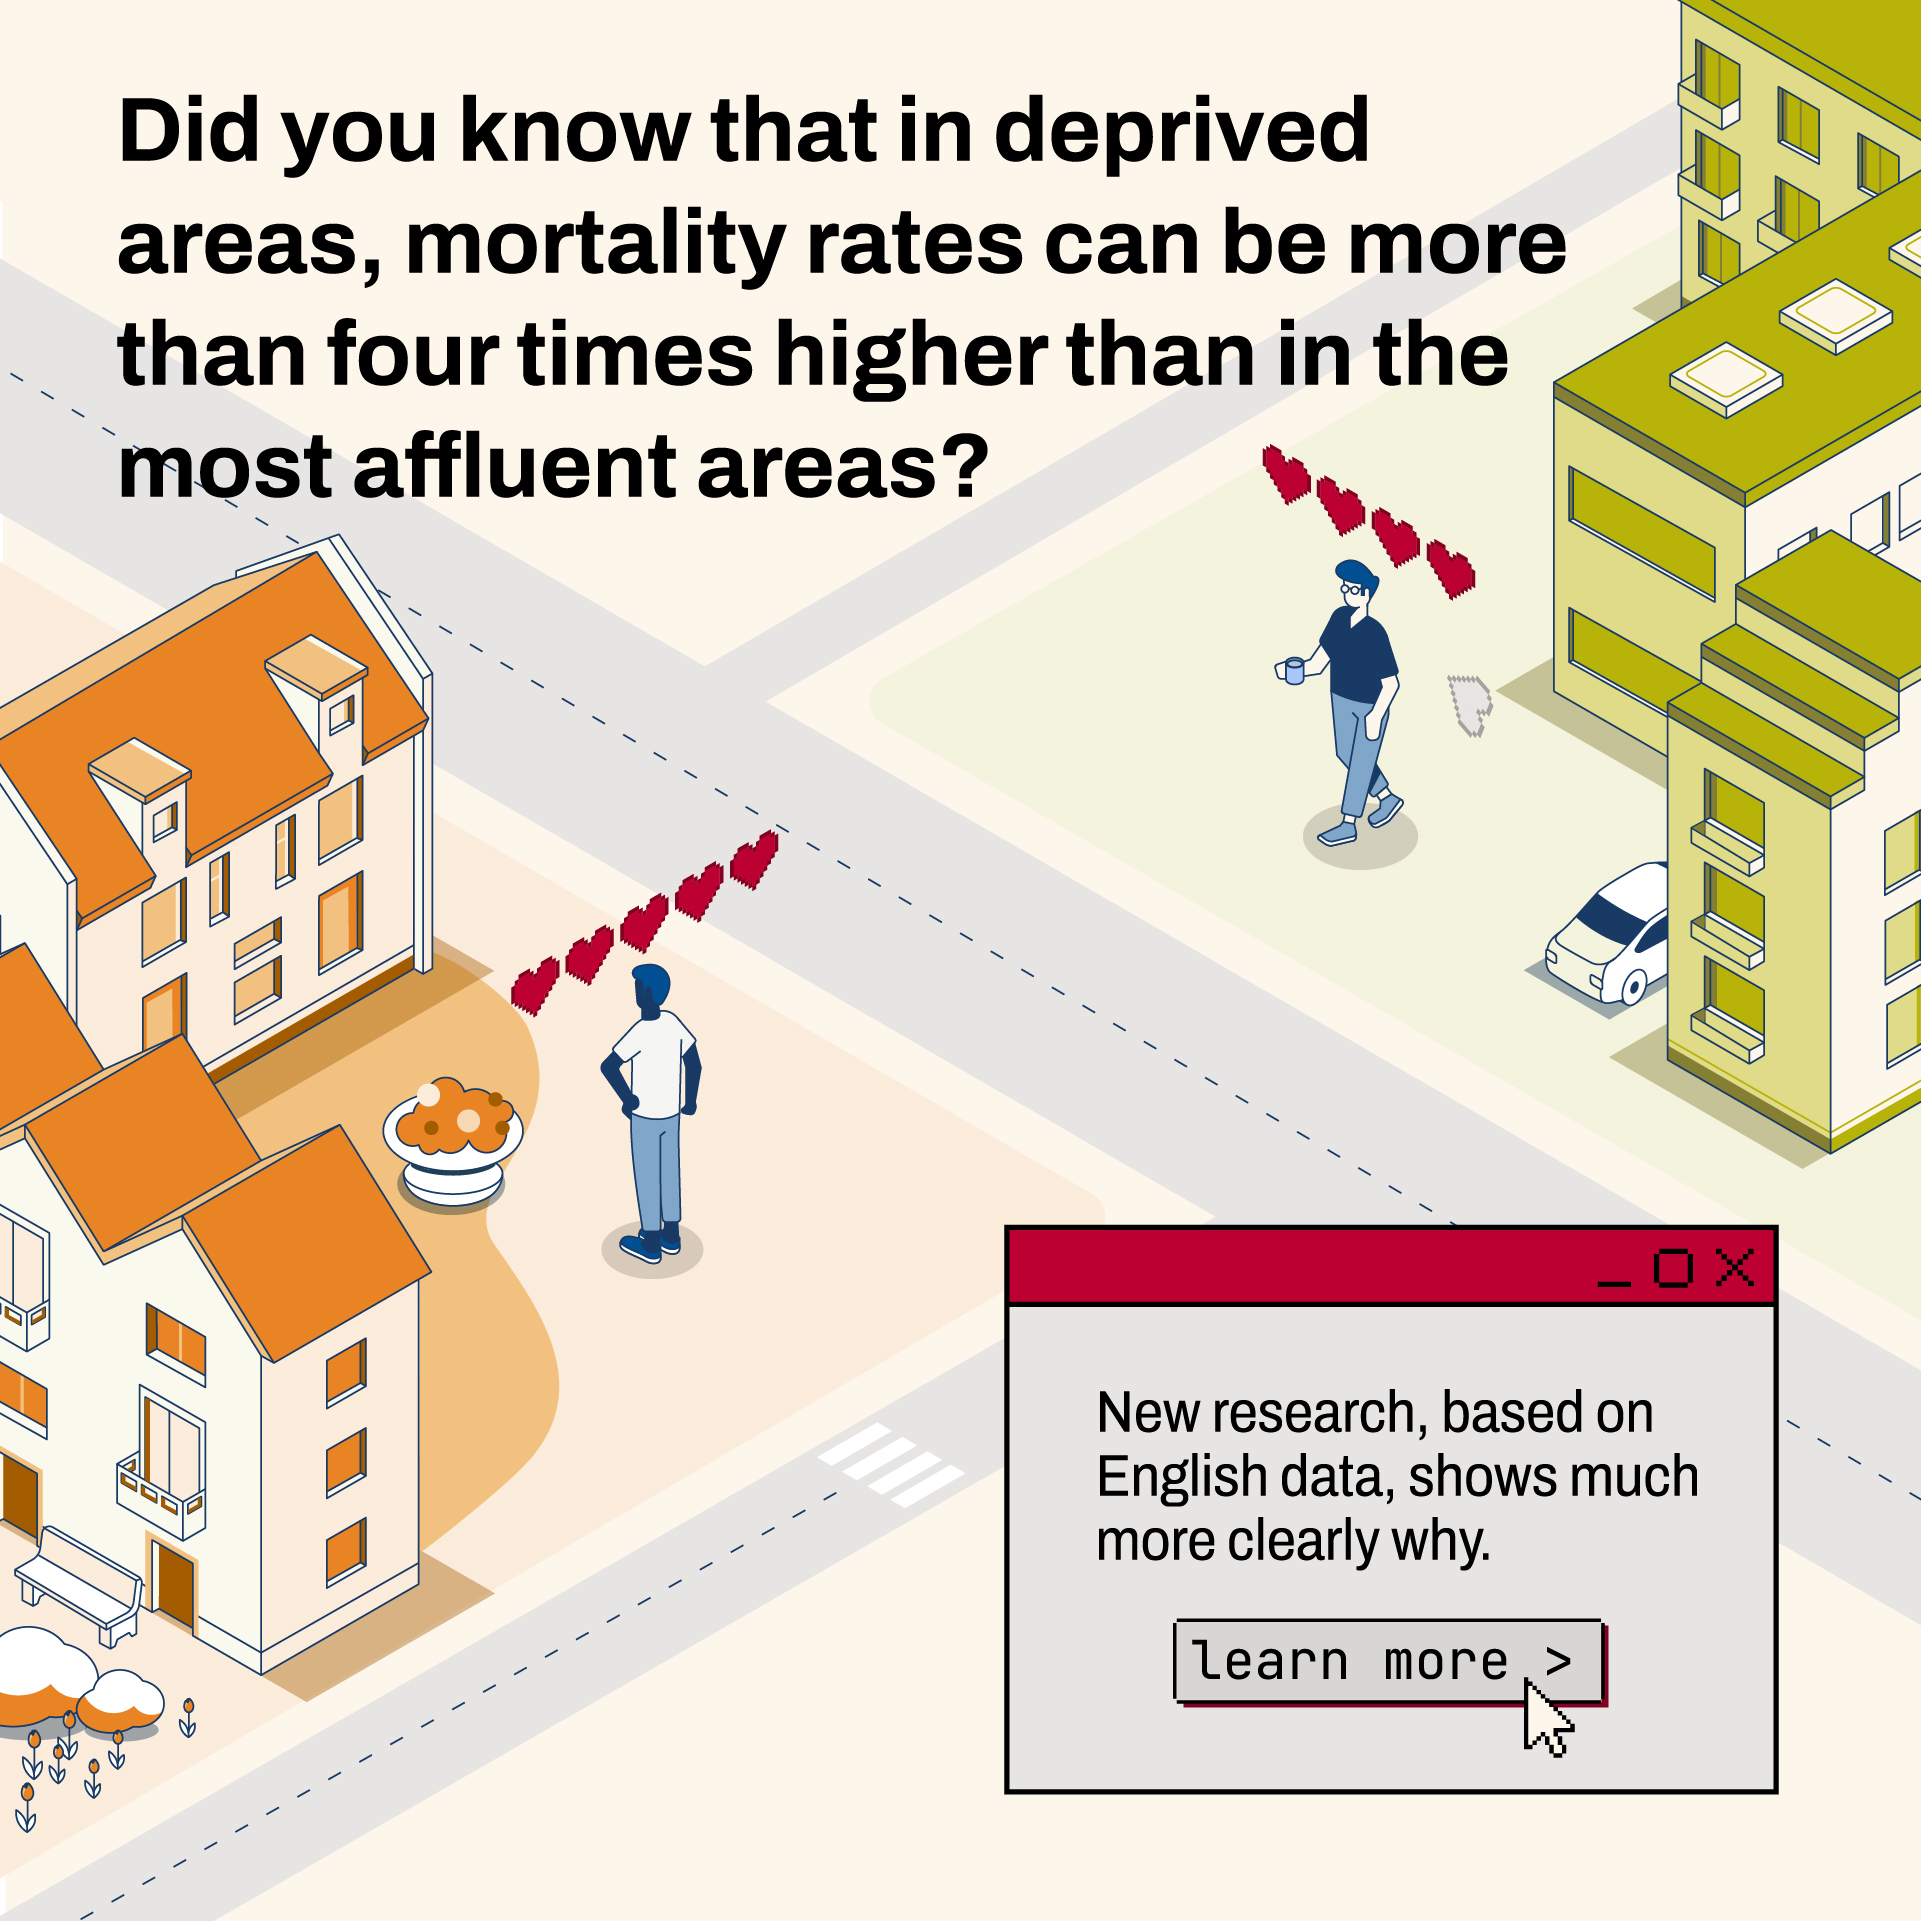
What explains the difference in life expectancy between neighbourhoods?
Torsten Kleinow (Research Centre for Longevity Risk, University of Amsterdam), Andrew Cairns (Heriot-Watt University), and Jie Wen (Lloyds Banking Group) present a new methodology to map this inequality with greater precision.
Their method can be used by policymakers to gain a more detailed understanding of variations in life expectancy. This enables more targeted policies to combat health inequality.
Local inequality is difficult to pinpoint
To analyze mortality differentials, researchers and policymakers often rely on general measures, such as the Index of Multiple Deprivation (IMD). While such indices are effective for highlighting socio-economic inequality at a national level, they prove less accurate for analysis at a regional or neighbourhood level. Neighbourhoods are often classified based on an aggregate score, causing nuances in the local context to be lost.
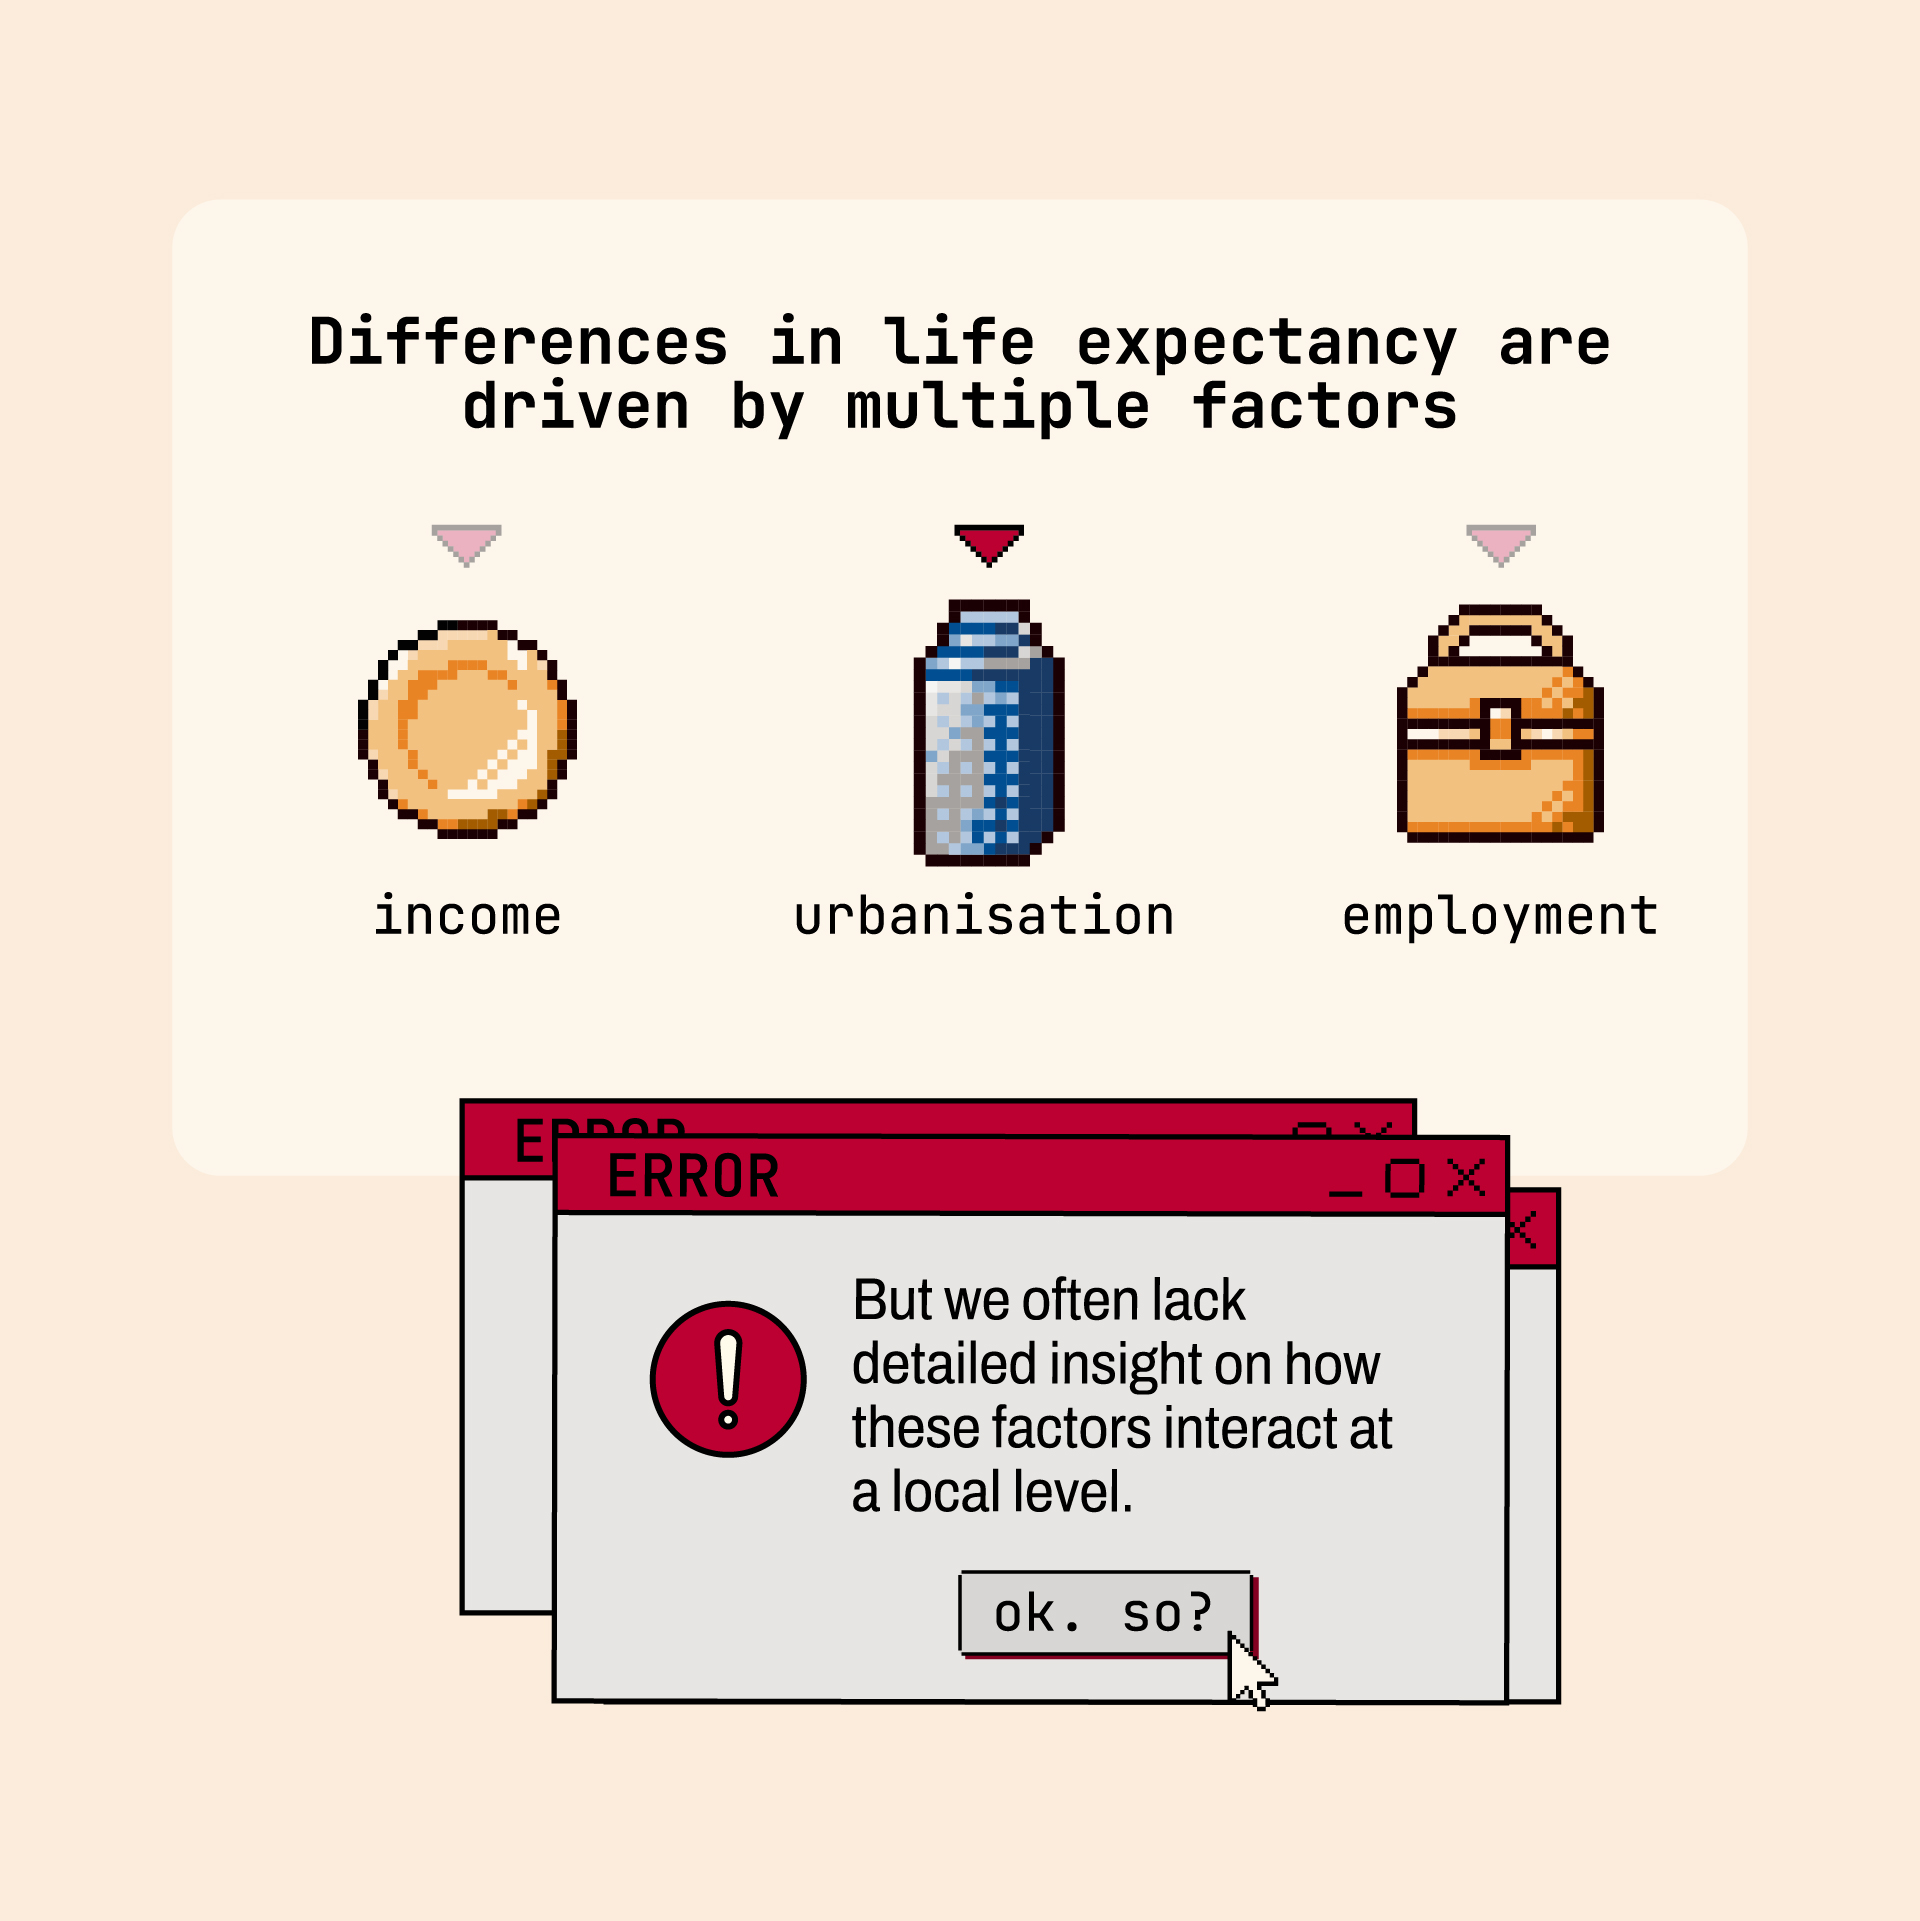
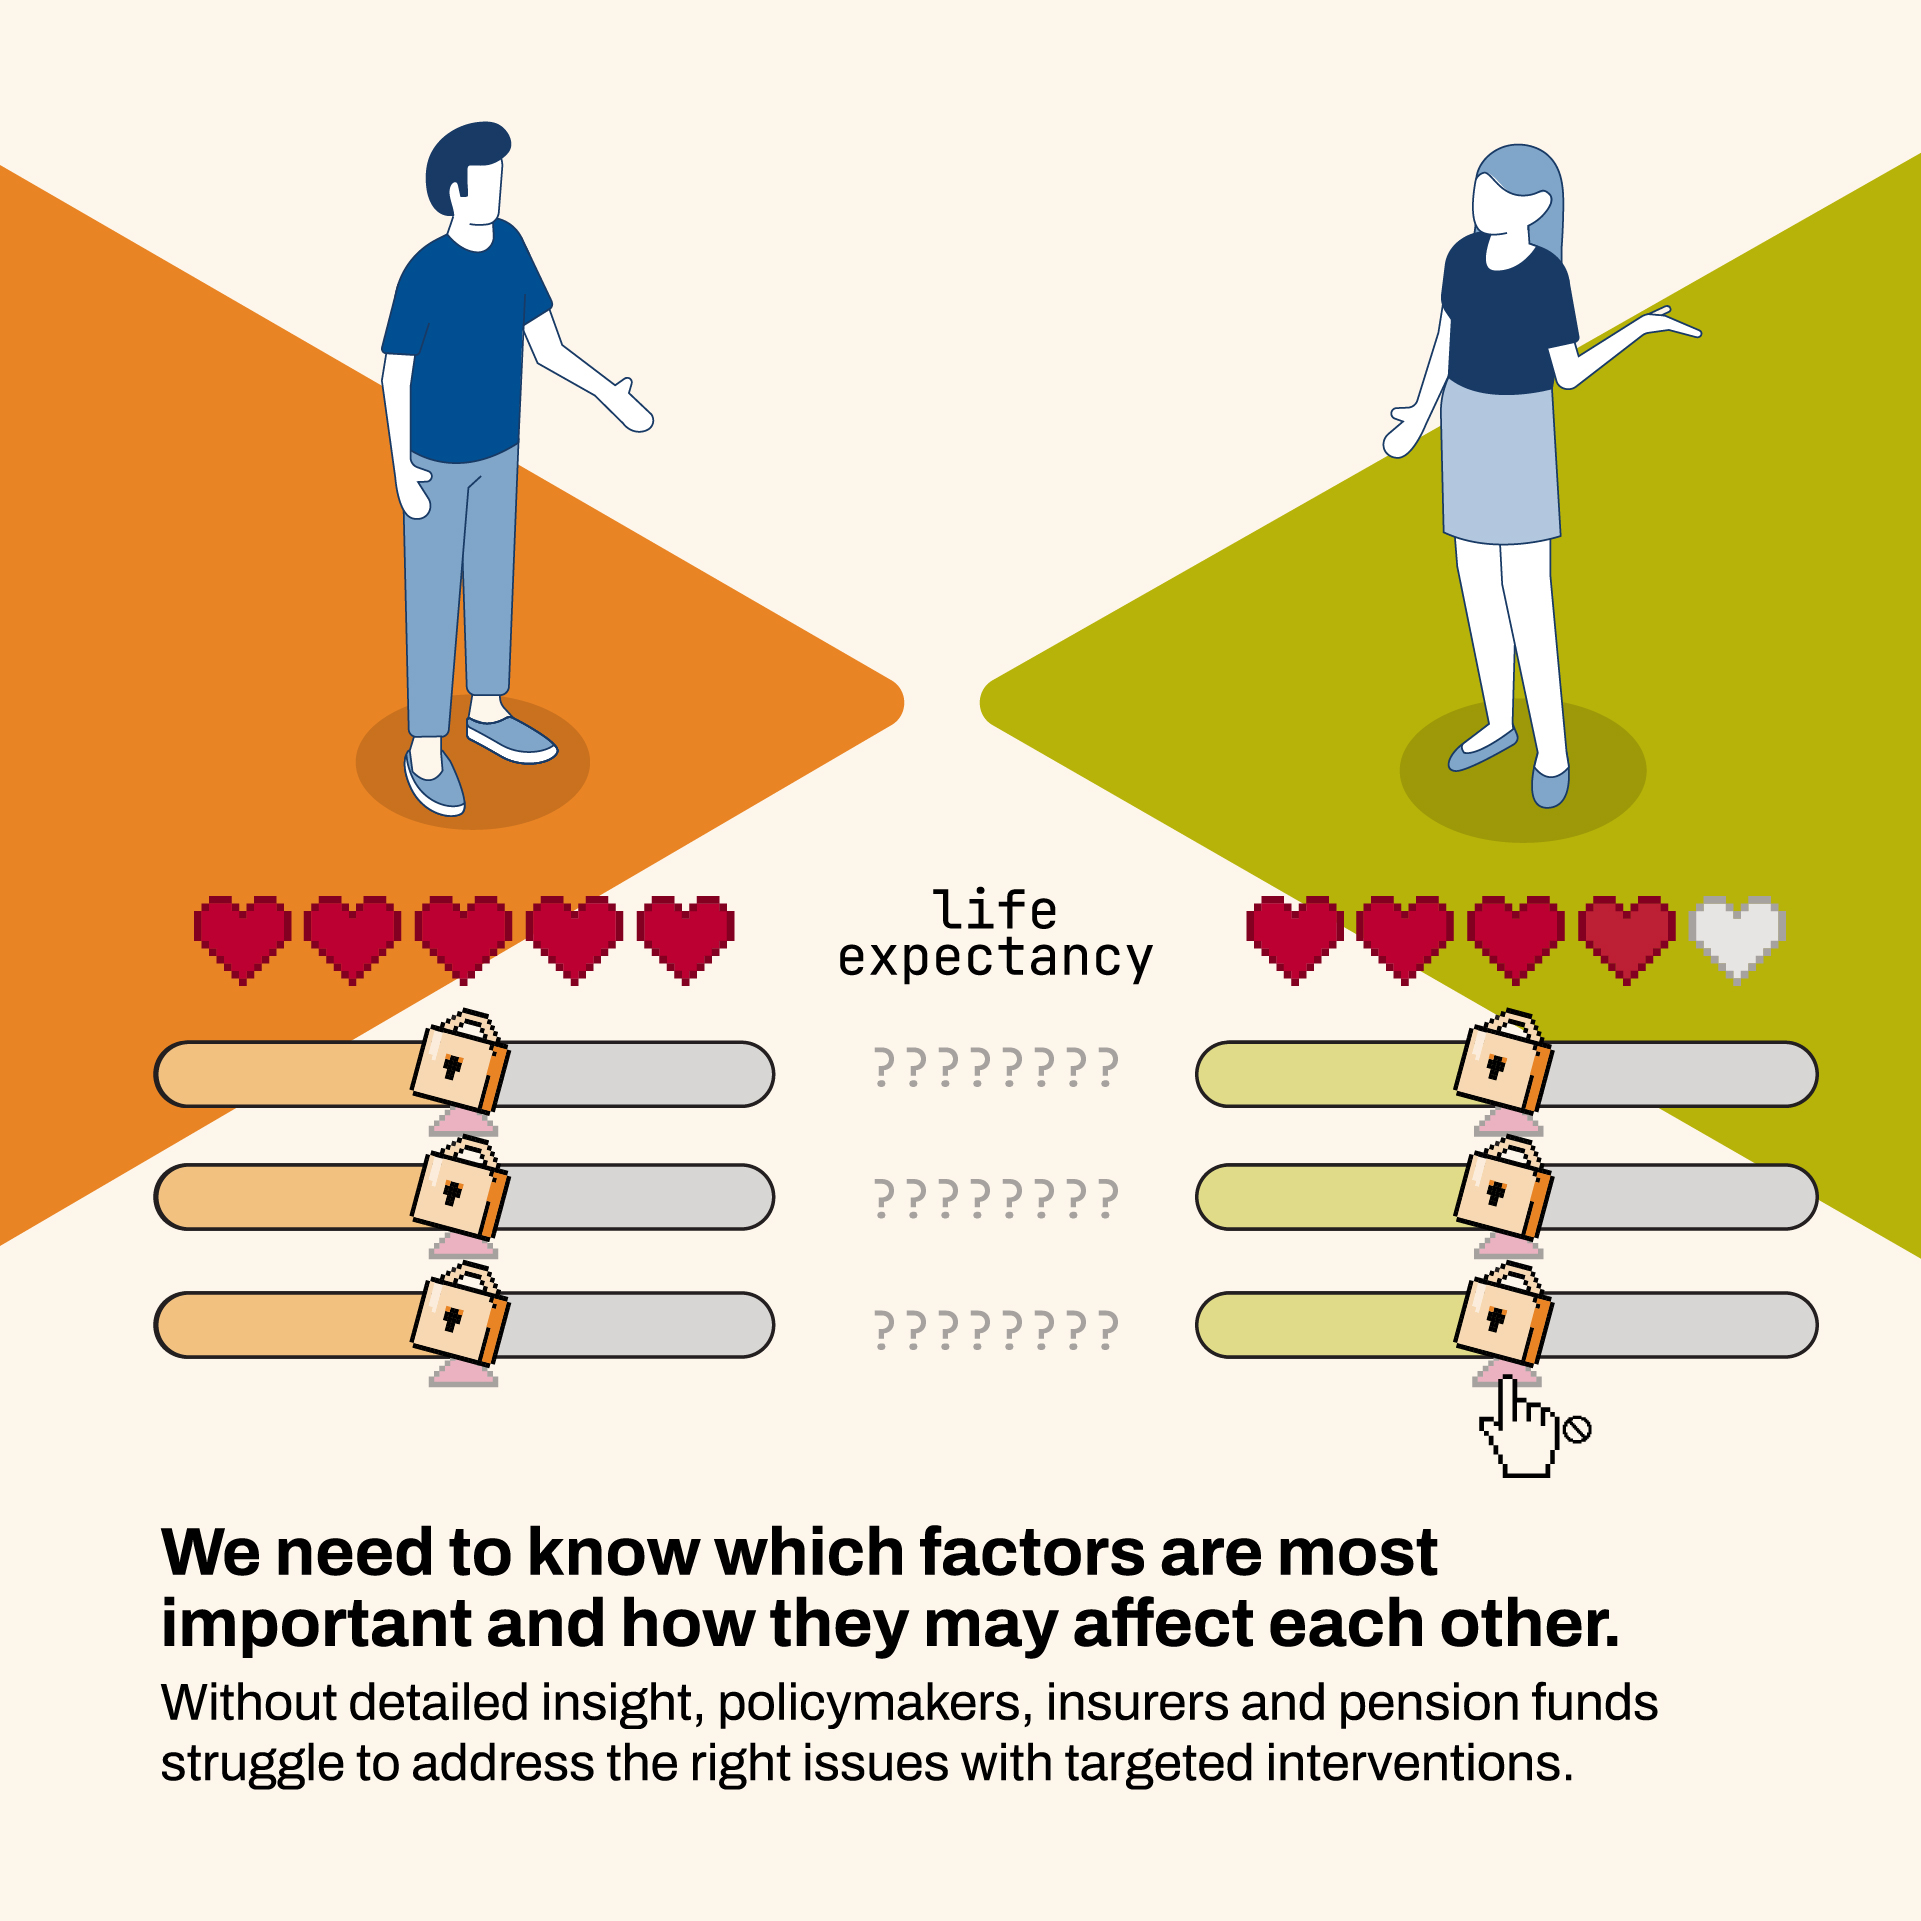
Studies that do analyze mortality rates at a local level often focus on a single factor, such as income or education. In practice, however, life expectancy is linked to multiple variables that interact with one another. For pension funds and insurers assessing longevity risks, as well as for governments shaping health policy, it is essential to understand how these factors interact at the local level.
Innovation through detailed modelling of small areas
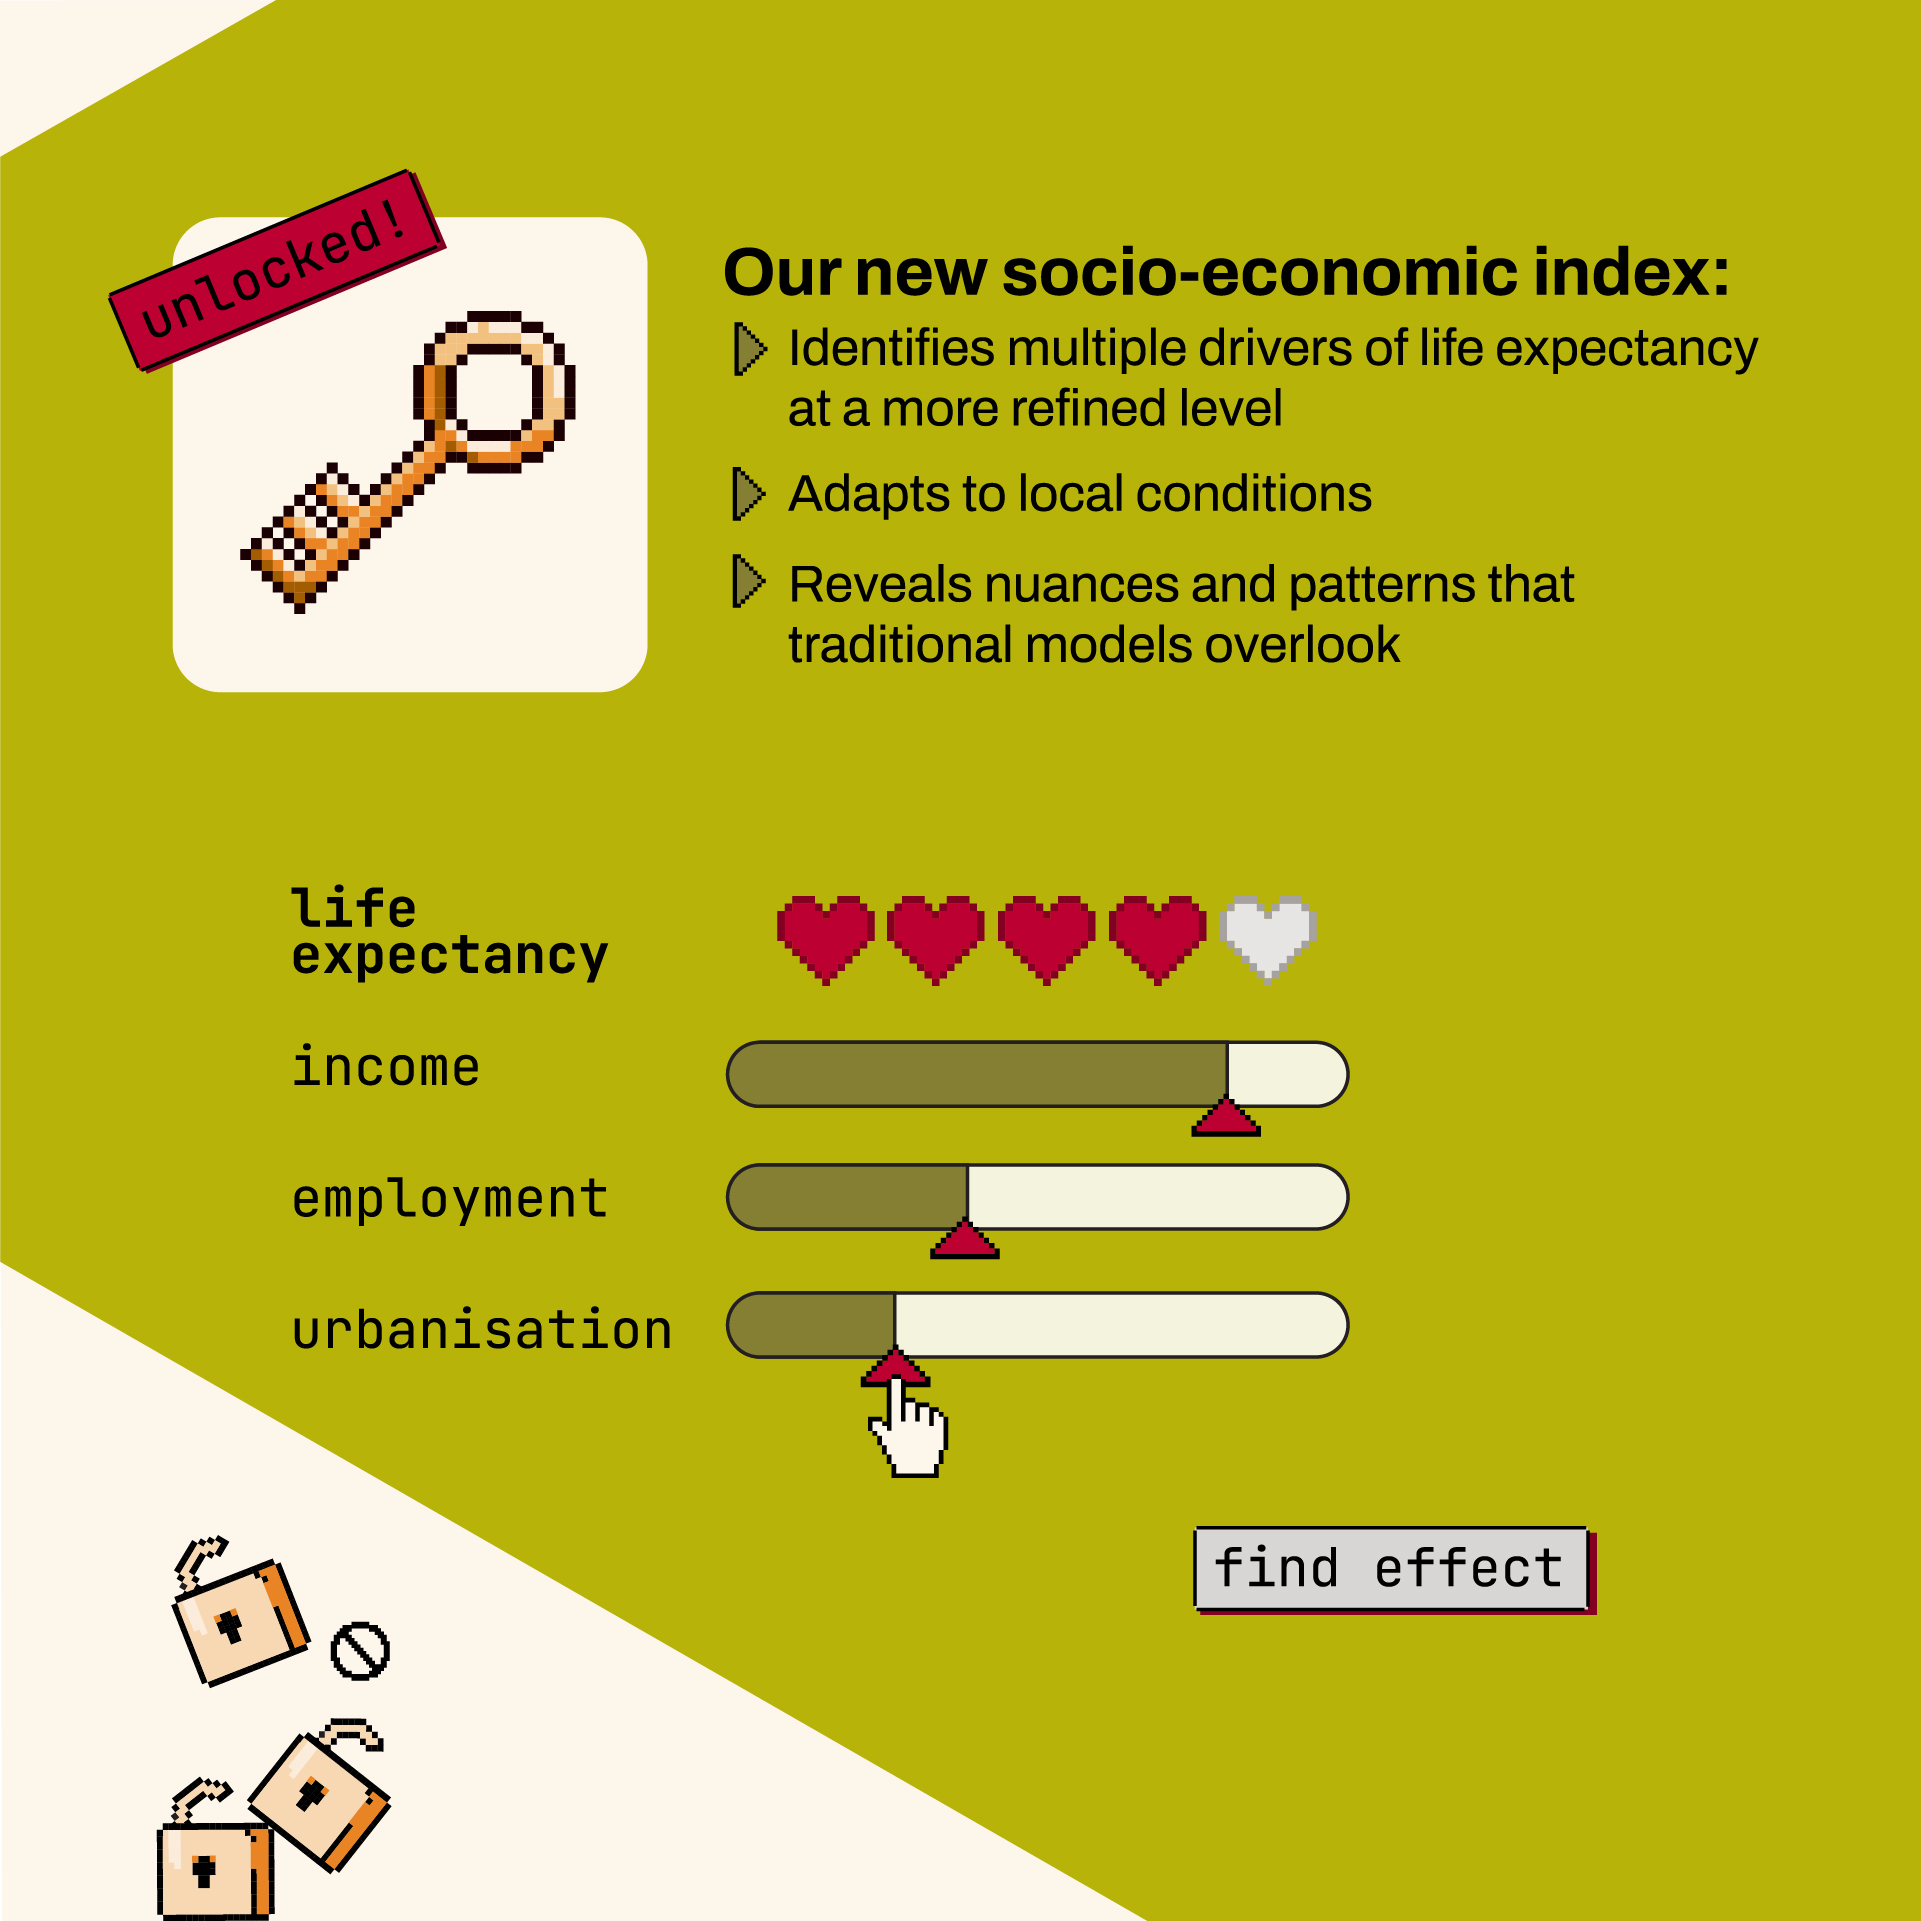
In their publication Drivers of mortality: risk factors and inequality, Andrew Cairns, Torsten Kleinow, and Jie Wen introduce a new socio-economic index. The core of their approach lies in the use of detailed observations of neighbourhood characteristics that are linked to local mortality rates through Local Linear Regression (LLR).
This statistical method allows for the simultaneous modelling of multiple socio-economic variables. Unlike traditional methods, LLR does not require the relationship between variables to be strictly defined in advance; the model adapts to the local data structure. This allows interactions between variables —which may vary by region—to be identified more accurately.
New patterns in life expectancy
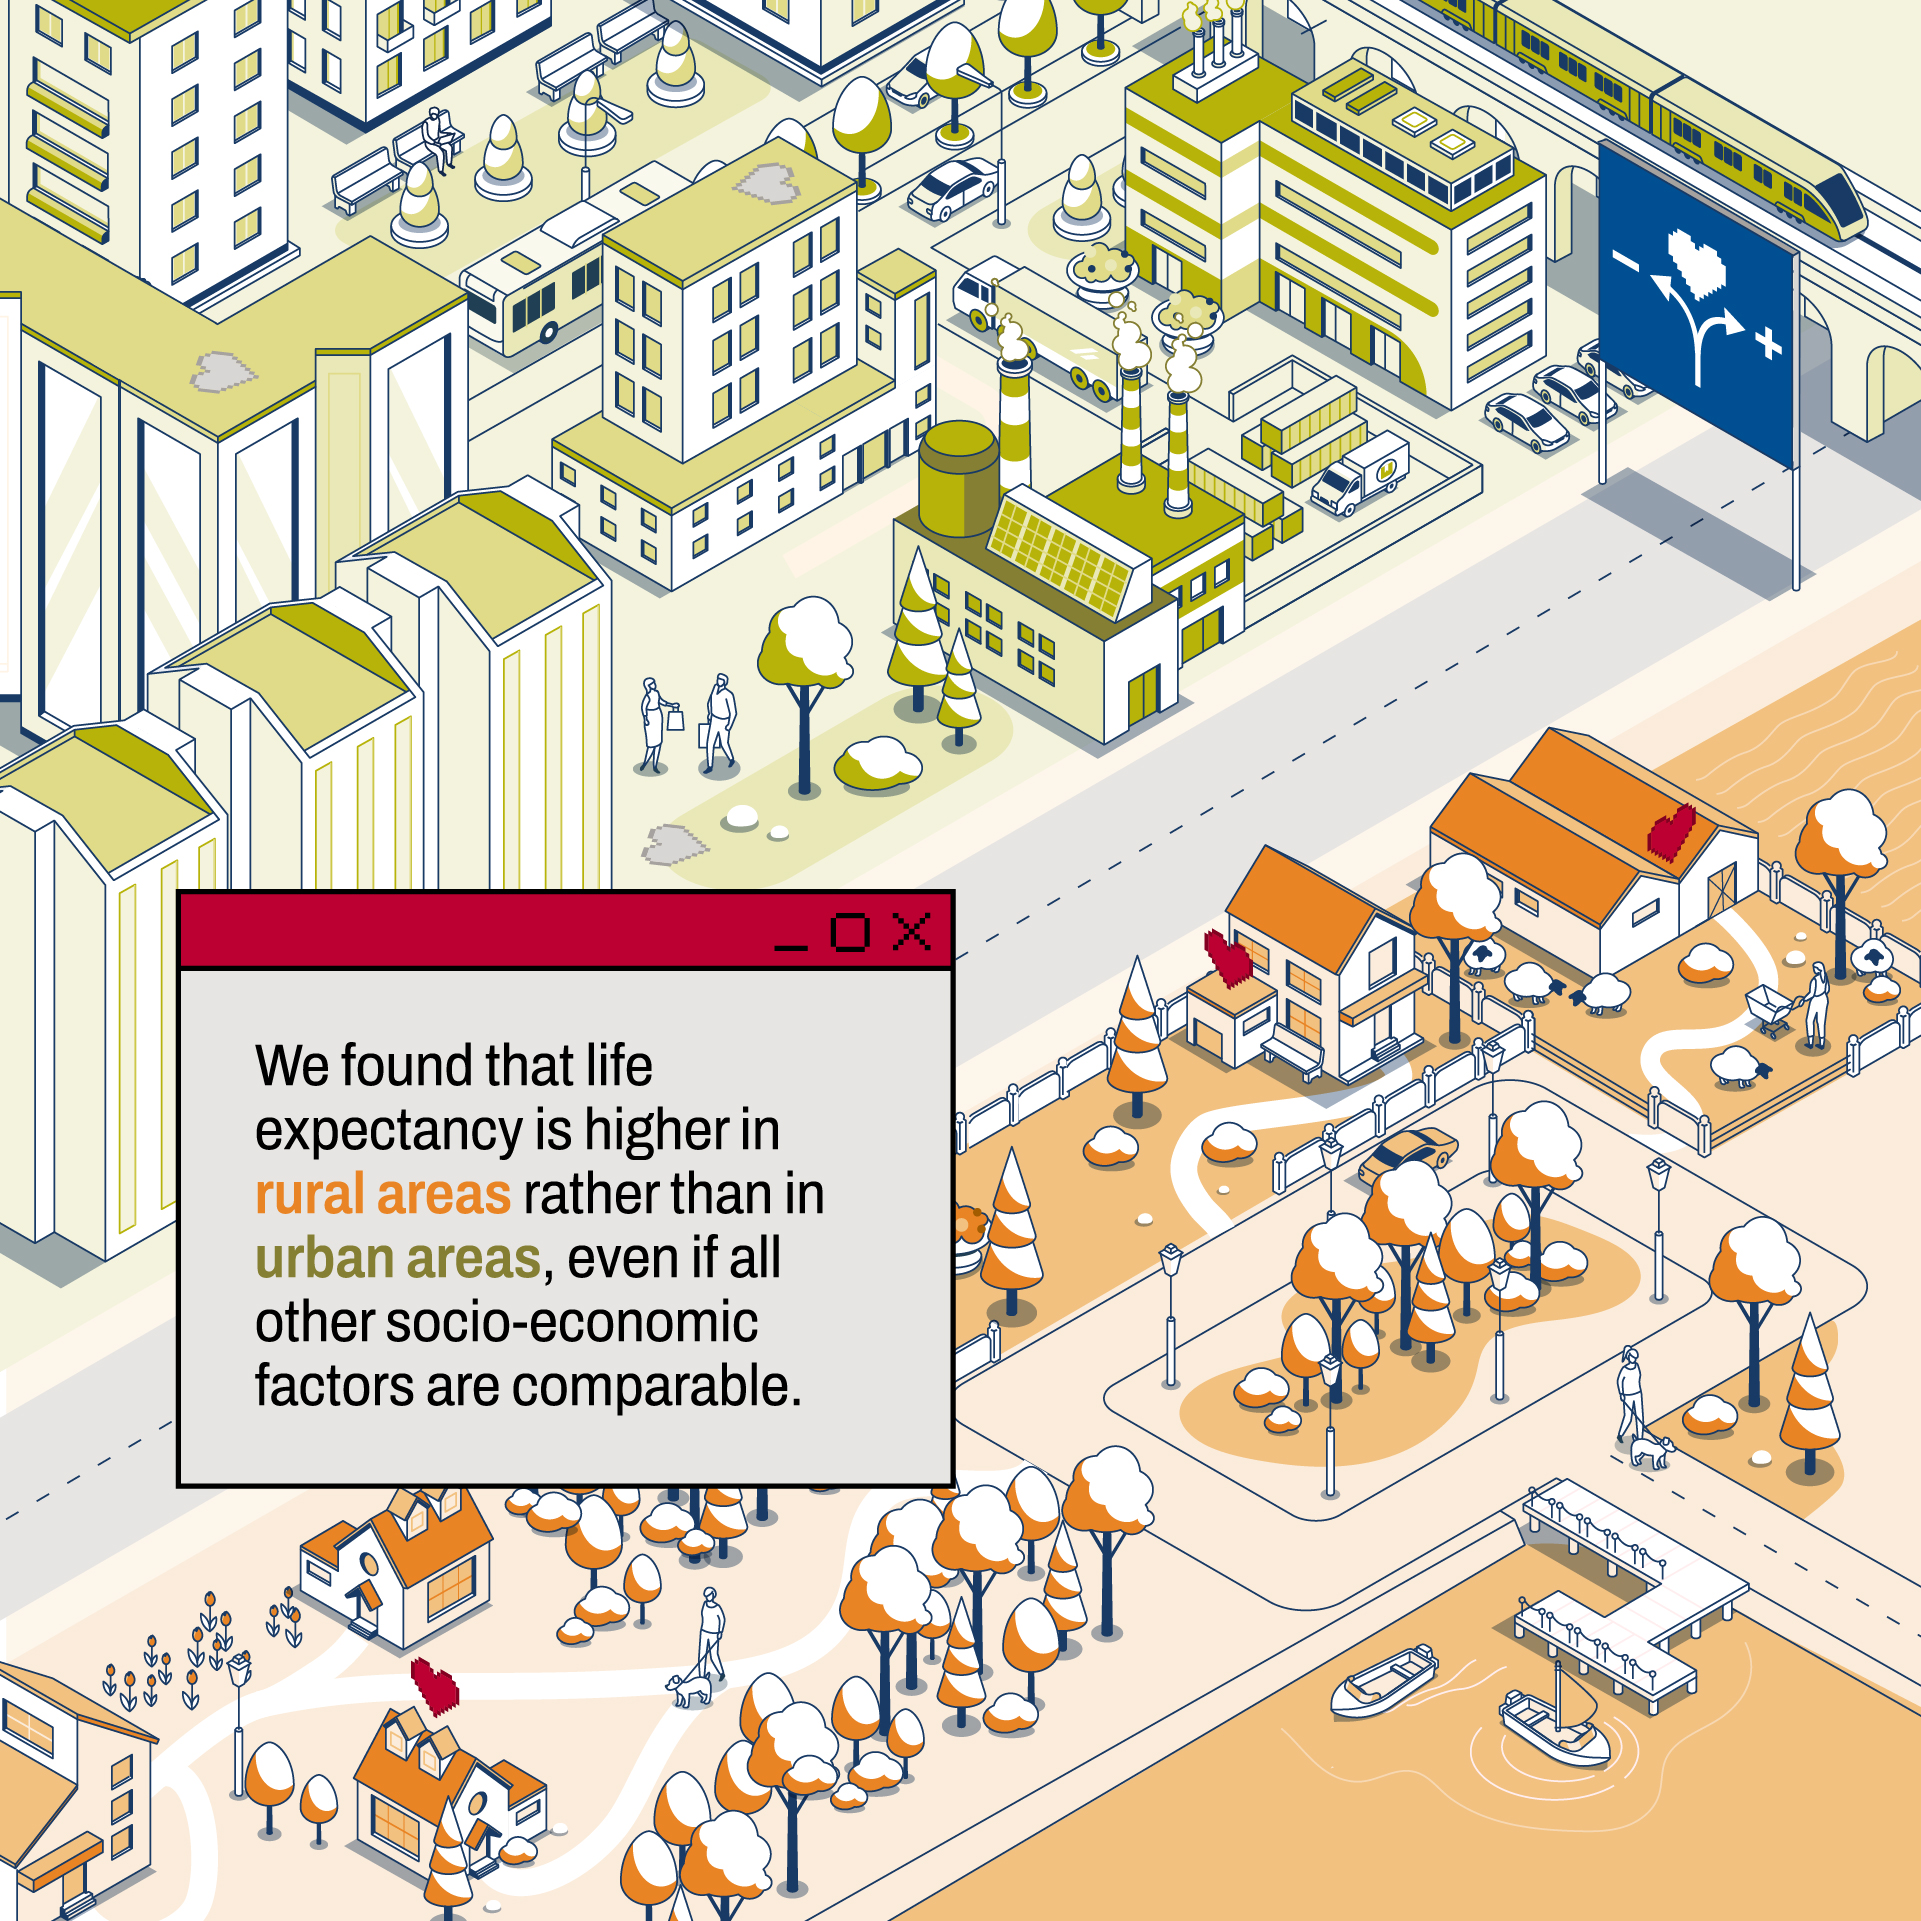
The researchers applied this index to detailed neighbourhood data from England. The analysis revealed several patterns that are often overlooked in standard models. For instance, the importance of the urban-rural dimension became clear: life expectancy in rural areas was found to be higher than in cities with a similar socio-economic profile. It also became evident that models focusing on mortality in small neighbourhoods must take local characteristics into account to avoid artificial biases. In particular, the presence of care homes in a neighbourhood strongly influences observed local mortality rates. The proposed model separates the care home effect and produces results that are driven by the underlying socio-economic factors that influence general neighbourhood longevity.

Our index allows us to identify the primary drivers of neighbourhood-level mortality differences with greater precision. The method offers the flexibility to reveal local nuances that remain hidden in traditional, less granular models.Torsten Kleinow (Research Centre for Longevity Risk, University of Amsterdam)
An interactive digital tool
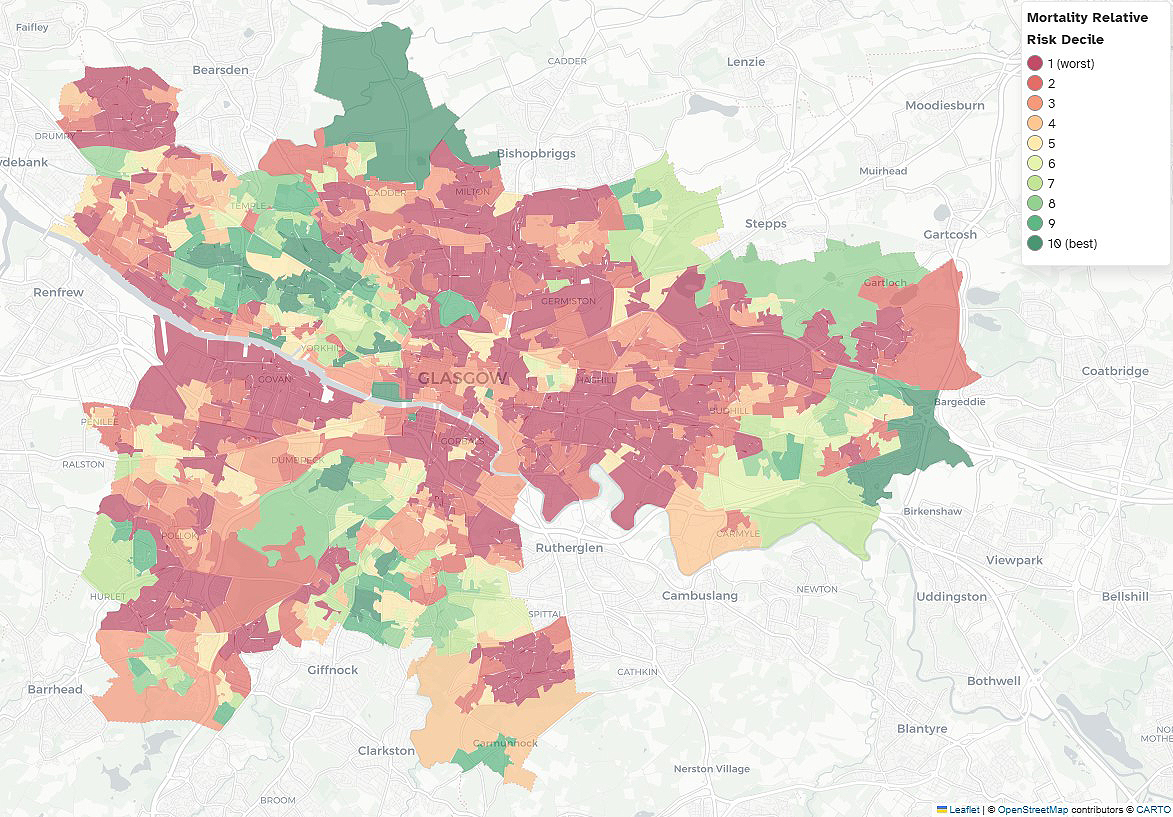
Building on this research, the researchers have also developed the Index of Scottish Life Expectancy (THISLE), an interactive digital application that applies the model to highly granular data from Scotland. Covering nearly 7,000 small-area “data zones,” the tool provides detailed, neighbourhood-level estimates of mortality risk and life expectancy by age and gender. It reveals stark inequalities, with differences of up to 20 years in life expectancy between areas, and allows users to explore how these patterns vary across the country. By translating advanced statistical modelling into an accessible interface, THISLE enables policymakers, health services, and local organisations to identify where interventions are most urgently needed and to better understand the social factors shaping these disparities.
Applicability and social value
The developed methodology is based on broadly applicable statistical techniques. This means the index can be implemented in other countries where comparable neighbourhood-level data is available. From a social perspective, this fine-grained analysis allows policymakers to better base interventions on empirical evidence. Rather than relying on generic policies, this research paves the way for targeted measures that address specific risk factors within a region or community. More accurate measurement is not an end in itself, but a prerequisite for effective policy that truly improves citizens’ life expectancy and well-being.
Want to know more?
The Impact Centre involved is: Research Centre for Longevity Risk
Publication
Drivers of mortality: risk factors and inequality. A.J.G. Cairns, T. Kleinow, and J. Wen (2024). Journal of the Royal Statistical Society Series A: Statistics in Society, 187.
Other sources
Scottish Life Expectancy (THISLE) Mapping tool
New app from Heriot-Watt shows sharp differences in life expectancy (March 23, 2026). The Herald Scotland